More pharmacology from every Cell Painting well
CHROMA-1 matches CellProfiler's pharmacological predictions with about half the treatment wells, or finds the same actives with 8–18% fewer follow-up assays when the wells are the same. It needs no batch correction and holds its lead in labs and cell types it has never seen.
Benjamin Midtvedt, Jesús Pineda, Henrik Klein Moberg, Giovanni Volpe, Mattias Goksör
The same plate: better answers, or twice the compounds
Today
CellProfiler + Harmony
96
compounds per plate
- Wells per compound
- 4
- Macro AP
- Reference
With CHROMA-1, option 1
Better answers, same wells
10–17%
fewer follow-up assays to find the same actives
- Wells per compound
- 4
- Macro AP
- +13–17%
With CHROMA-1, option 2
Same answers, half the wells
192
compounds per plate
- Wells per compound
- ≈2
- Macro AP
- Matches CellProfiler
A Cell Painting screen is paid for twice. First in wells: every replicate a compound needs is a well that could have tested another compound, another dose or another cell line. Then in follow-up: every false lead the profiles produce costs a confirmatory assay, and every real active they miss is a hit the program never sees.
CHROMA-1 cuts both bills.
In the whitepaper we are publishing today, CHROMA-1 matches CellProfiler, the field's reference method, on protein activity, mechanism of action and safety pharmacology with about half the treatment wells. Given the same wells, it ranks compounds better at every budget we tested, so the same actives turn up after 8 to 18% fewer follow-up assays. It needs no batch-correction step, keeps its lead in laboratories, staining protocols and cell types it was never trained on, and finds a signal for bacterial mutagenicity in the same images, where CellProfiler is close to random.
≈0%
fewer treatment wells for the same predictions of protein activity, mechanism of action and safety pharmacology
0–0%
fewer follow-up assays to find the same actives from the same wells, at full replication
0.0×
enrichment for low-dose Ames mutagens over random ranking. CellProfiler: 1.3×
+0%
cross-laboratory retrieval with no batch correction, against the best alternative with its best correction
Same answers from half the wells
We put CHROMA-1 to work on the questions a screening team asks about every compound. Which proteins does it act on? How does it work? Does it hit targets with known safety liabilities? Concretely: 24 protein-activity assays, 20 mechanism-of-action classes and 58 endpoints from the Safety-77 secondary-pharmacology panel, predicted for held-out compounds in BBBC047, a public Cell Painting screen of 30,000 small-molecule treatments. At every replicate budget we drew 20 random selections of wells and compared CHROMA-1, uncorrected, with CellProfiler features corrected with Harmony.
Treatment wells needed to match CellProfiler
How many CHROMA-1 wells per compound reach the macro AP that CellProfiler gets from a given budget. Mean over 20 random well selections.
CellProfiler + Harmony
CHROMA-1
- Well used
- Well freed by CHROMA-1
3.4
CHROMA-1 wells match 7 CellProfiler wells (± 1.0 SD)
52% fewer
55% on average across protein activity budgets
›Show dataHide data
| Endpoint family | CellProfiler wells | CHROMA-1 wells (mean ± SD) | Fewer wells |
|---|---|---|---|
| Protein activity | 2 | 1.05 ± 0.09 | 48% |
| Protein activity | 3 | 1.27 ± 0.33 | 58% |
| Protein activity | 4 | 1.68 ± 0.49 | 58% |
| Protein activity | 5 | 2.14 ± 0.80 | 57% |
| Protein activity | 6 | 2.68 ± 0.75 | 55% |
| Protein activity | 7 | 3.39 ± 1.00 | 52% |
| Mechanism of action | 2 | 1.05 ± 0.13 | 48% |
| Mechanism of action | 3 | 1.49 ± 0.43 | 50% |
| Mechanism of action | 4 | 2.07 ± 0.58 | 48% |
| Mechanism of action | 5 | 2.78 ± 0.91 | 44% |
| Mechanism of action | 6 | 3.25 ± 1.05 | 46% |
| Mechanism of action | 7 | 3.14 ± 0.92 | 55% |
| Safety pharmacology | 2 | 1.02 ± 0.07 | 49% |
| Safety pharmacology | 3 | 1.12 ± 0.17 | 63% |
| Safety pharmacology | 4 | 1.50 ± 0.33 | 63% |
The result held for every endpoint family at every budget: CHROMA-1 reaches CellProfiler's macro average precision with roughly half the wells. For mechanism of action, three CHROMA-1 wells match seven CellProfiler wells. On a fixed plate budget, that is room for about twice the compounds, or for the doses and conditions that usually get cut.
Better answers from the same wells
Hold the wells fixed instead and look at what the predictions cost downstream. A screening team uses them to rank compounds for follow-up, so we ranked the held-out compounds by predicted activity and counted the follow-up assays needed to find half of the true actives.
With the same wells per compound, CHROMA-1 needs 8% fewer follow-up assays for protein activity, 18% fewer for mechanism of action and 15% fewer for safety pharmacology, at the highest replication we tested. For mechanism of action, that is 39 follow-up tests per confirmed active instead of 45.
Follow-up assays needed to find the same actives
Held-out compounds are ranked by predicted activity and tested in that order until half of the true actives are found. Both methods use the same wells per compound.
- Follow-up assay run
- Follow-up assay saved by CHROMA-1
CellProfiler + Harmony
100 follow-up assays
CHROMA-1
82 follow-up assays
18% fewer
follow-up assays to find half the true actives, at 7 wells per compound
- Follow-up tests per confirmed active
- 45.3→39.0
- Actives per 100 tests, top 5% of the ranking
- 5.4→6.5random 2.0
- Library tested to find half the actives
- 38.9%→33.6%random ≈ 49%
›Show dataHide data
| Endpoint family | Wells | Library tested for half the actives | Fewer assays | Tests per active | Hits per 100 (top 5%) |
|---|---|---|---|---|---|
| Protein activity | 1 | 41.9% → 37.5% | 12.1% | 6.72 → 6.05 | 24.56 → 33.06 |
| Protein activity | 2 | 38.7% → 35.5% | 11.5% | 6.23 → 5.69 | 31.32 → 37.00 |
| Protein activity | 3 | 37.5% → 32.7% | 16.3% | 6.06 → 5.27 | 33.71 → 40.65 |
| Protein activity | 4 | 35.3% → 32.8% | 9.9% | 5.70 → 5.29 | 37.37 → 42.24 |
| Protein activity | 5 | 34.5% → 31.5% | 10.7% | 5.61 → 5.06 | 39.40 → 42.79 |
| Protein activity | 6 | 34.0% → 31.6% | 9.7% | 5.53 → 5.11 | 41.19 → 43.06 |
| Protein activity | 7 | 33.6% → 31.3% | 8.3% | 5.50 → 5.07 | 41.90 → 44.46 |
| Mechanism of action | 1 | 39.0% → 33.9% | 17.1% | 44.92 → 39.31 | 3.97 → 4.95 |
| Mechanism of action | 2 | 36.7% → 30.4% | 25.0% | 42.46 → 35.79 | 4.65 → 6.45 |
| Mechanism of action | 3 | 39.9% → 33.1% | 22.6% | 46.06 → 38.92 | 4.53 → 6.20 |
| Mechanism of action | 4 | 38.1% → 33.6% | 16.7% | 43.82 → 39.71 | 5.29 → 6.40 |
| Mechanism of action | 5 | 35.9% → 31.3% | 16.4% | 41.26 → 36.20 | 5.78 → 6.79 |
| Mechanism of action | 6 | 35.4% → 32.5% | 12.7% | 40.66 → 38.11 | 6.29 → 6.87 |
| Mechanism of action | 7 | 38.9% → 33.6% | 18.3% | 45.30 → 38.99 | 5.41 → 6.53 |
| Safety pharmacology | 1 | 40.8% → 35.7% | 14.9% | 11.87 → 11.04 | 25.54 → 33.27 |
| Safety pharmacology | 2 | 37.7% → 32.7% | 16.1% | 11.27 → 10.31 | 30.40 → 35.44 |
| Safety pharmacology | 3 | 36.3% → 31.4% | 16.2% | 11.05 → 9.97 | 32.43 → 37.39 |
| Safety pharmacology | 4 | 34.6% → 30.1% | 15.2% | 10.67 → 9.61 | 34.47 → 37.51 |
The gap is widest when replication is lowest. At one well per compound, as in many primary screens, the top 5% of CHROMA-1's ranking holds 35% more true actives than CellProfiler's for protein activity, 30% more for safety pharmacology and 25% more for mechanism of action.
Behind these numbers is a better ranking at every budget. Macro average precision, which scores the whole ranked list, is on average 14% higher for protein activity, 23% higher for mechanism of action and 16% higher for safety pharmacology. One CHROMA-1 well beats two CellProfiler wells on all three endpoint families, and for safety pharmacology it matches three.
Better predictions at every well budget
Macro average precision for held-out compounds as replicate wells are added. Mean over 20 well selections; whiskers show ± 1 SD.
- CHROMA-1, no batch correction
- CellProfiler + Harmony
- CellProfiler at its full budget
Protein activity
+14% on average · +4.4 AP points
Mechanism of action
+23% on average · +2.1 AP points
Safety pharmacology
+16% on average · +4.5 AP points
›Show dataHide data
| Endpoint family | Wells | CHROMA-1 macro AP | CellProfiler macro AP | Gain |
|---|---|---|---|---|
| Protein activity | 1 | 0.311 ± 0.016 | 0.256 ± 0.020 | +22% |
| Protein activity | 2 | 0.353 ± 0.013 | 0.295 ± 0.016 | +20% |
| Protein activity | 3 | 0.370 ± 0.007 | 0.319 ± 0.015 | +16% |
| Protein activity | 4 | 0.385 ± 0.012 | 0.340 ± 0.012 | +13% |
| Protein activity | 5 | 0.393 ± 0.011 | 0.351 ± 0.015 | +12% |
| Protein activity | 6 | 0.394 ± 0.009 | 0.364 ± 0.011 | +8% |
| Protein activity | 7 | 0.397 ± 0.007 | 0.375 ± 0.008 | +6% |
| Mechanism of action | 1 | 0.083 ± 0.009 | 0.063 ± 0.010 | +31% |
| Mechanism of action | 2 | 0.101 ± 0.010 | 0.076 ± 0.006 | +32% |
| Mechanism of action | 3 | 0.115 ± 0.008 | 0.091 ± 0.005 | +26% |
| Mechanism of action | 4 | 0.119 ± 0.007 | 0.102 ± 0.008 | +17% |
| Mechanism of action | 5 | 0.131 ± 0.007 | 0.110 ± 0.007 | +19% |
| Mechanism of action | 6 | 0.135 ± 0.004 | 0.114 ± 0.006 | +18% |
| Mechanism of action | 7 | 0.137 ± 0.005 | 0.115 ± 0.005 | +20% |
| Safety pharmacology | 1 | 0.292 ± 0.009 | 0.239 ± 0.011 | +22% |
| Safety pharmacology | 2 | 0.317 ± 0.005 | 0.274 ± 0.009 | +16% |
| Safety pharmacology | 3 | 0.335 ± 0.007 | 0.290 ± 0.006 | +15% |
| Safety pharmacology | 4 | 0.344 ± 0.008 | 0.305 ± 0.007 | +13% |
The gain is largest on the compounds that are hardest to call. Among compounds with the weakest CellProfiler phenotypes, CHROMA-1's advantage is 7.75 AP points larger than among strong phenotypes for protein activity, and 6.25 points larger for safety pharmacology. Phenotype strength was defined without the activity labels and on separate wells. These are the compounds a conventional screen is most likely to write off as inactive.
It is not just counting cells. Cell count alone can be a powerful bioactivity baseline, and the protein-activity benchmark, from Seal et al., was designed with exactly that in mind. Here cell count is far less predictive than either full profile, and CHROMA-1 keeps its lead when cell-count features are appended, when their linear contribution is removed, and among compounds whose cell counts stay within 15% of vehicle controls.
The reason is in the profiles. Compound and dose explain 43.6% of the variation in CHROMA-1 profiles, against 25.5% for Harmony-corrected CellProfiler. An independent variance model predicts that 0.44 CHROMA-1 wells deliver the signal-to-noise ratio of one CellProfiler well, close to the halving seen in the predictions.
Mutagenicity, from images you already have
The Ames test measures whether a compound mutates bacteria, a readout no human-cell image obviously contains. We linked BBBC047 compounds to dose-qualified Ames results from the U.S. National Toxicology Program and asked which test positive at or below 10, 30 or 100 µg per plate.
At the lowest threshold, CHROMA-1's ranking reaches 2.9 times the average precision of a random one, against 1.3 times for CellProfiler. CHROMA-1's 95% intervals exclude random at all three thresholds; CellProfiler's include it at all three. The cohorts are small, 85 to 91 compounds, so the intervals are wide.
Ames mutagenicity, predicted from Cell Painting
Average precision on held-out compounds divided by its value under random ranking, at three dose thresholds. Bars show the mean over outer folds; whiskers show 95% bootstrap intervals.
- CHROMA-1, no batch correction
- CellProfiler + Harmony
- Random ranking
›Show dataHide data
| Threshold | Compounds (positive) | CHROMA-1 [95% CI] | CellProfiler [95% CI] | Ratio |
|---|---|---|---|---|
| ≤ 10 µg/plate | 87 (11) | 2.89× [2.08–3.92] | 1.27× [0.77–2.68] | 2.28× |
| ≤ 30 µg/plate | 85 (12) | 2.33× [1.58–3.39] | 1.37× [0.80–2.51] | 1.70× |
| ≤ 100 µg/plate | 91 (19) | 1.75× [1.28–2.45] | 1.02× [0.70–1.61] | 1.72× |
It is no substitute for an Ames test, but screens already in the archive can now help decide which compounds get one first.
Reliable across labs, protocols and cell types
Pool Cell Painting data from two labs and the first thing you see is the labs. On the JUMP consortium's TARGET2 plates, imaged in several laboratories on different microscopes, uncorrected CHROMA-1 profiles find the same compound across labs 28% better than the strongest alternative with its best correction: 0.676 mAP against 0.529, and 0.509 for CellProfiler.
Finding the same compound across laboratories
Nonreplicate retrieval mAP on JUMP TARGET2 plates imaged in several laboratories on different microscopes, following Arevalo et al. Higher is better.
- CHROMA-1
- CHROMA-1 + Seurat CCA
- CellProfiler
- Other learned models
›Show dataHide data
| Method | Correction | Retrieval mAP | Batch mixing |
|---|---|---|---|
| CHROMA-1 | Seurat CCA | 0.707 | 0.629 |
| CHROMA-1 | No correction | 0.676 | 0.511 |
| MorphEM single-cell | MAD + Seurat CCA | 0.529 | 0.591 |
| CellProfiler | Seurat CCA | 0.509 | 0.561 |
| CellProfiler | scVI | 0.502 | 0.456 |
| CellProfiler | Seurat RPCA | 0.493 | 0.518 |
| CellProfiler | Harmony | 0.490 | 0.517 |
| CellProfiler | fastMNN | 0.487 | 0.511 |
| MorphEM multi-cell | MAD + Seurat CCA | 0.482 | 0.542 |
| CellProfiler | Scanorama | 0.439 | 0.548 |
| CellProfiler | ComBat | 0.438 | 0.374 |
| CellProfiler | No correction | 0.426 | 0.367 |
| SubCell | MAD + Seurat CCA | 0.414 | 0.496 |
| CellProfiler | Sphering | 0.398 | 0.338 |
| OpenPhenom | MAD + Seurat CCA | 0.381 | 0.457 |
| CellProfiler | DESC | 0.372 | 0.272 |
| CellCLIP | MAD + Seurat CCA | 0.347 | 0.443 |
It is also far less dependent on control wells. Conventional profiles are interpreted against the plate's vehicle controls and need many good ones; CHROMA-1 loses only 0.1 to 0.4 macro-AP points with a single control well per plate, while CellProfiler loses 1.3 to 2.5 with two.
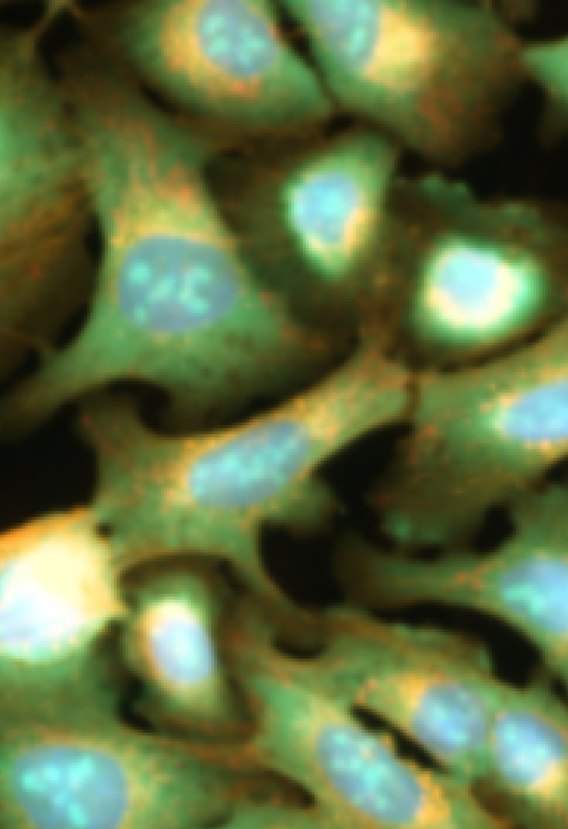
The lead holds further from home. Trained on U2OS cells, CHROMA-1 led every comparator, uncorrected, on gene-overexpression plates from a new lab, on an independent screen with a different staining protocol, in A549 lung carcinoma cells and in primary human hepatocytes.
Four steps away from its training data
Retrieval mAP in each collection, comparing methods within the dataset. CHROMA-1 was trained on U2OS cells from the JUMP consortium.
- No batch correction
- Best-performing correction
- CHROMA-1
- CellProfiler
- Other learned models
U2OS · JUMP gene overexpression
›Show dataHide data
| Collection | Method | No correction | Best correction | Condition |
|---|---|---|---|---|
| JUMP gene overexpression (U2OS) | CHROMA-1 | 0.261 | 0.262 | MAD |
| JUMP gene overexpression (U2OS) | CellProfiler | 0.143 | 0.186 | Harmony |
| JUMP gene overexpression (U2OS) | MorphEM multi-cell | 0.075 | 0.174 | MAD + whitening |
| JUMP gene overexpression (U2OS) | OpenPhenom | 0.059 | 0.112 | MAD + whitening |
| JUMP gene overexpression (U2OS) | CellCLIP | 0.054 | 0.073 | MAD + whitening |
| JUMP gene overexpression (U2OS) | SubCell | 0.049 | 0.068 | MAD |
| BBBC047 (U2OS) | CHROMA-1 | 0.186 | 0.189 | MAD + whitening |
| BBBC047 (U2OS) | CellProfiler | 0.093 | 0.103 | Harmony |
| BBBC047 (U2OS) | MorphEM multi-cell | 0.062 | 0.099 | MAD + whitening |
| BBBC047 (U2OS) | OpenPhenom | 0.050 | 0.059 | MAD + whitening |
| BBBC047 (U2OS) | CellCLIP | 0.120 | 0.128 | MAD |
| BBBC047 (U2OS) | SubCell | 0.054 | 0.078 | MAD + whitening |
| LINCS (A549) | CHROMA-1 | 0.667 | 0.667 | No correction |
| LINCS (A549) | CellProfiler | 0.487 | 0.540 | Harmony |
| LINCS (A549) | MorphEM multi-cell | 0.357 | 0.543 | MAD + Seurat CCA |
| LINCS (A549) | OpenPhenom | 0.287 | 0.399 | MAD + Harmony |
| LINCS (A549) | CellCLIP | 0.348 | 0.440 | MAD + Seurat CCA |
| LINCS (A549) | SubCell | 0.290 | 0.346 | MAD + Seurat CCA |
| OASIS (Primary hepatocytes) | CHROMA-1 | 0.123 | 0.133 | MAD + whitening |
| OASIS (Primary hepatocytes) | CellProfiler | 0.078 | 0.086 | Harmony |
| OASIS (Primary hepatocytes) | MorphEM multi-cell | 0.052 | 0.100 | MAD + whitening |
| OASIS (Primary hepatocytes) | OpenPhenom | 0.041 | 0.058 | MAD + Seurat CCA |
| OASIS (Primary hepatocytes) | CellCLIP | 0.053 | 0.082 | MAD + Seurat CCA |
| OASIS (Primary hepatocytes) | SubCell | 0.050 | 0.080 | MAD + Seurat CCA |
Ahead of Phenom-2, at a fraction of the compute
RxRx3-core is Recursion's benchmark for recovering known biology: linking compounds to their targets, and genes to their complexes and pathways. Its images are HUVEC cells in six channels, unlike anything CHROMA-1 was trained on, and RxRx3 is part of the data behind Recursion's Phenom models. CHROMA-1 scores highest on all five endpoints, narrowly ahead of Phenom-2, which trained for 48,000 H100 GPU-hours with 1.86 billion parameters. CHROMA-1 trained for 11.6 GPU-hours with 50.4 million.
RxRx3-core: known biology, recovered in HUVEC cells
Drug–target retrieval (mAP) and gene–gene relationship recall across four databases. Higher is better. CHROMA-1 is evaluated zero-shot.
- CHROMA-1
- CellProfiler
- Other models († trained on collections that include RxRx3)
What it took to get there
›Show dataHide data
| Model | Drug–target (mAP) | CORUM (recall) | hu.MAP (recall) | Reactome (recall) | STRING (recall) |
|---|---|---|---|---|---|
| CHROMA-1 | 0.311 | 0.487 | 0.568 | 0.206 | 0.424 |
| Phenom-2 † | 0.307 | 0.486 | 0.553 | 0.197 | 0.415 |
| Phenom-1 † | 0.290 | 0.395 | 0.482 | 0.188 | 0.349 |
| MorphEM multi-cell | 0.281 | 0.405 | 0.461 | 0.149 | 0.348 |
| CellProfiler | 0.276 | 0.361 | 0.444 | 0.160 | 0.330 |
| OpenPhenom † | 0.274 | 0.300 | 0.352 | 0.158 | 0.281 |
| SubCell multi-cell | 0.264 | 0.402 | 0.474 | 0.149 | 0.352 |
| ViT-WSL | 0.259 | 0.249 | 0.290 | 0.148 | 0.242 |
| CellCLIP | 0.257 | 0.354 | 0.416 | 0.145 | 0.307 |
| ViT-ImageNet | 0.256 | 0.342 | 0.420 | 0.144 | 0.305 |
| CLOOME | — | 0.328 | 0.406 | 0.135 | 0.276 |
| MolPhenix | — | 0.262 | 0.306 | 0.142 | 0.241 |
Profiling is cheap too. CHROMA-1 profiled the 25,329-well cross-laboratory benchmark in 0.87 GPU-hours, 171 times faster than single-cell MorphEM, the strongest alternative. A 100,000-compound screen takes about four GPU-hours, and a million-well archive under two days on one GPU.
What this changes for a screening program
- Fewer wells per compound. About half the treatment replicates for the same predictions, freeing plate space for more compounds, doses or conditions.
- Fewer follow-up assays. With the same wells, 8–18% fewer to find the same actives.
- Less reliance on controls and correction. Interpretable with a single vehicle-control well per plate, and comparable across labs, microscopes and protocols without fitting a correction model.
- More from existing archives. A million wells re-profiled in under two days on one GPU, with new readouts such as an early mutagenicity flag.
The whitepaper has the methods, every comparison and the statistics behind each number. To see what CHROMA-1 finds in your own screens, talk to us.
Whitepaper · 14 pages · PDF
Efficiency at Scale: CHROMA-1 for Morphological Profiling of Cell Painting Data
Benjamin Midtvedt, Jesús Pineda, Henrik Klein Moberg, Giovanni Volpe, Mattias Goksör · IFLAI AB
Full methods, all comparisons, the variance analysis, cell-count and phenotype-strength controls, and the statistics behind every number in this post.
Notes
- Metrics. mAP is mean average precision. Macro AP is average precision averaged equally over the endpoints in a family. Relative gains at equal budgets are the mean of per-budget ratios of CHROMA-1 to CellProfiler macro AP.
- Corrections. CHROMA-1 uses no post hoc batch correction unless stated. CellProfiler profiles use the feature preprocessing of Arevalo et al. throughout, plus Harmony in the pharmacology and Ames evaluations.
- Well equivalents. CHROMA-1 wells needed to reach CellProfiler's macro AP at each reference budget, by linear interpolation between measured budgets within each of 20 matched well selections; mean ± SD across selections.
- Follow-up assays. Held-out compounds are ranked by predicted score, pooled across validation folds, and tested in rank order until half the true actives are found; reductions are geometric means across endpoints. Ranking within folds gives the same picture (8.3%, 17.4% and 14.7% fewer at the highest budgets).
- Ames. Average precision divided by its expected value under random ranking, with 95% intervals from 10,000 paired compound-bootstrap resamples. Interval endpoints in the chart are read from Figure 5 of the whitepaper.
- Compute. GPU-hours on NVIDIA GH200, including image loading and preprocessing; single-cell MorphEM's time excludes the segmentation it needs. Phenom-1 and Phenom-2 have no public checkpoints, so their RxRx3-core scores and training budgets are as reported by their authors.
- Plate illustration. The plates at the top of this post are schematics of 384 treatment wells at four CellProfiler replicates per compound, not experimental plate maps. Option 2 assumes the measured 1.5 to 2.1 CHROMA-1 well equivalents round to two.